Traffix Program, Safe Routes To School (SR2S) Infographic
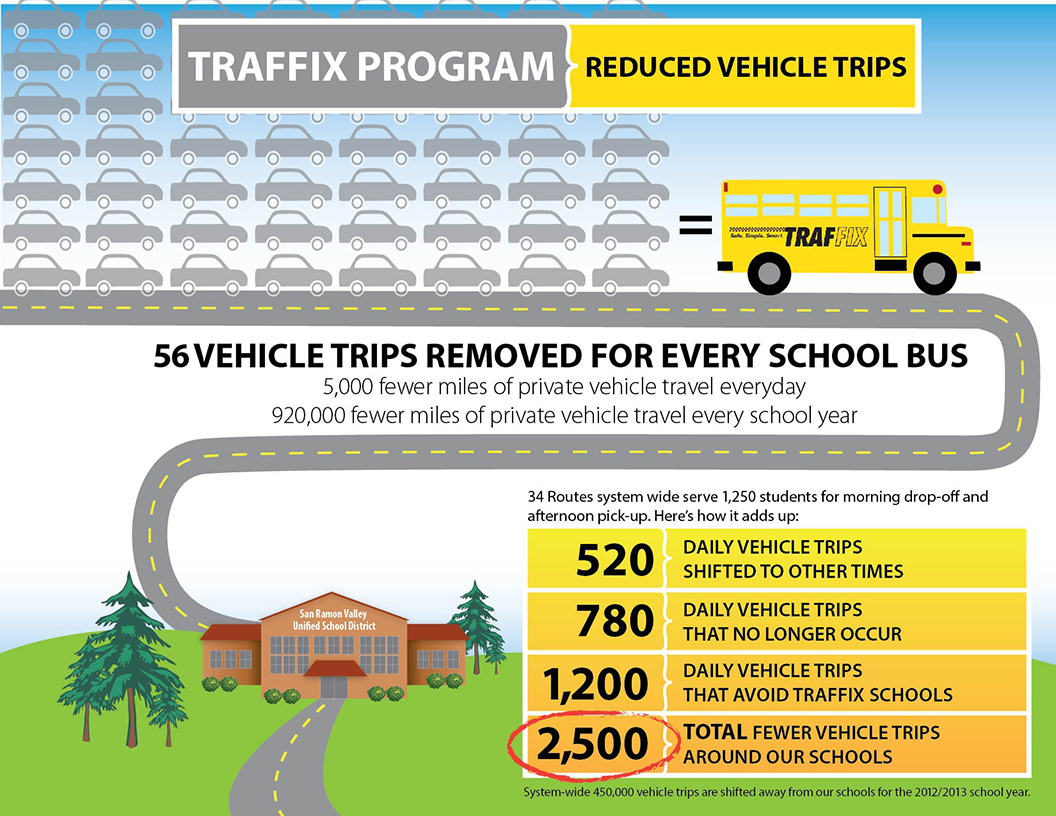
From involved analysis comes data – often in tables. But when communicating with the public, or another audience that does not have professional-engineer-level training, an effort is required to simplify the data to a short list of understandable visuals. In this case, an infographic was needed to illustrate the auto-trip-reducing effects of an enhanced bus strategy.
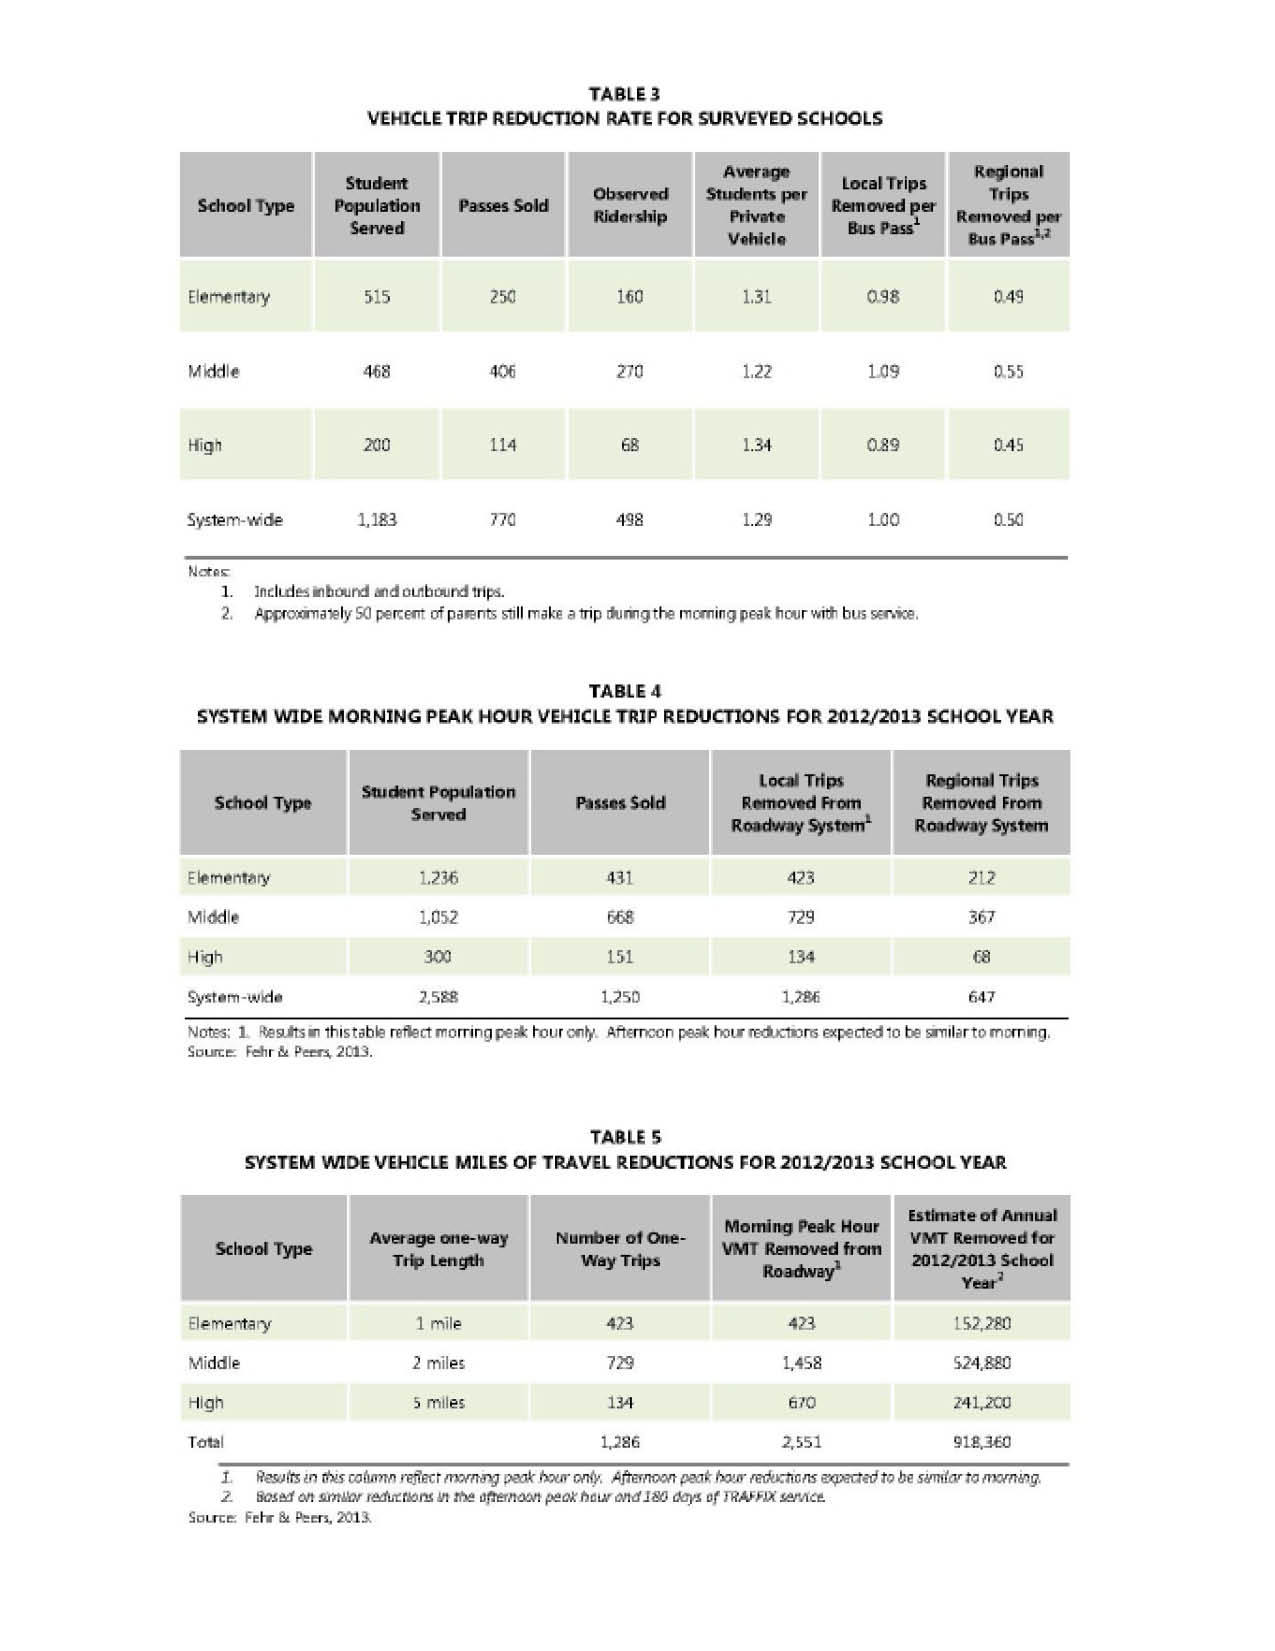
The original data